Reports that show profit, not just revenue
Sales are counted together with cost, so the report shows the margin straight away — by day, by dish, by employee and by order source.
- Revenue, profit, average check, guests, by hour and by day
- ABC analysis: which items bring in most of the revenue and which do not
- CSV export — for your accountant and your own spreadsheet
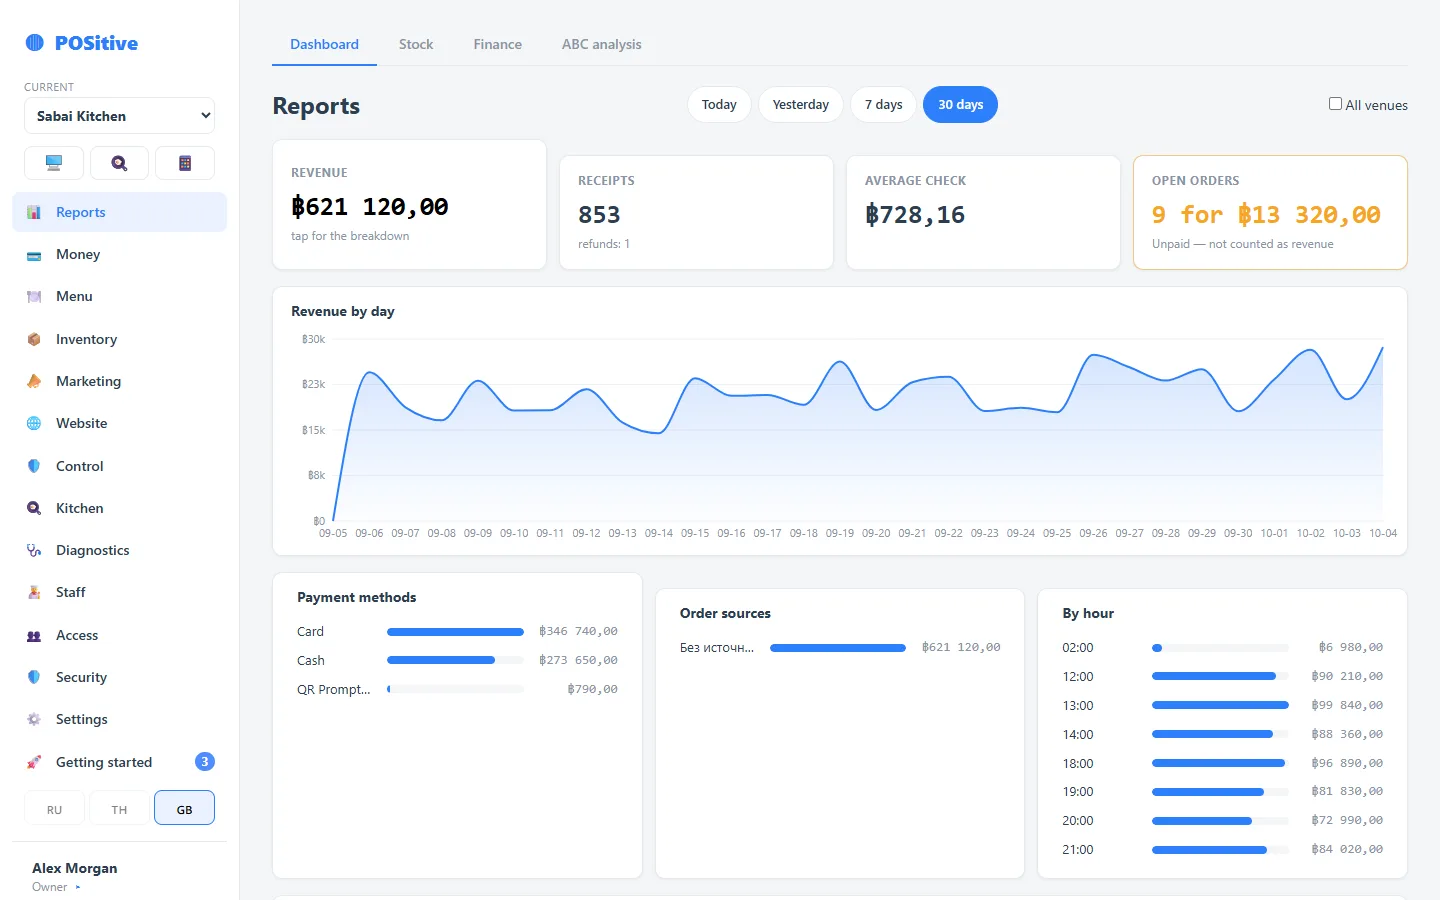
Three questions the dashboard answers
How much we earned
Revenue and profit for the period, average check, number of receipts and guests, refunds — compared with the previous period.
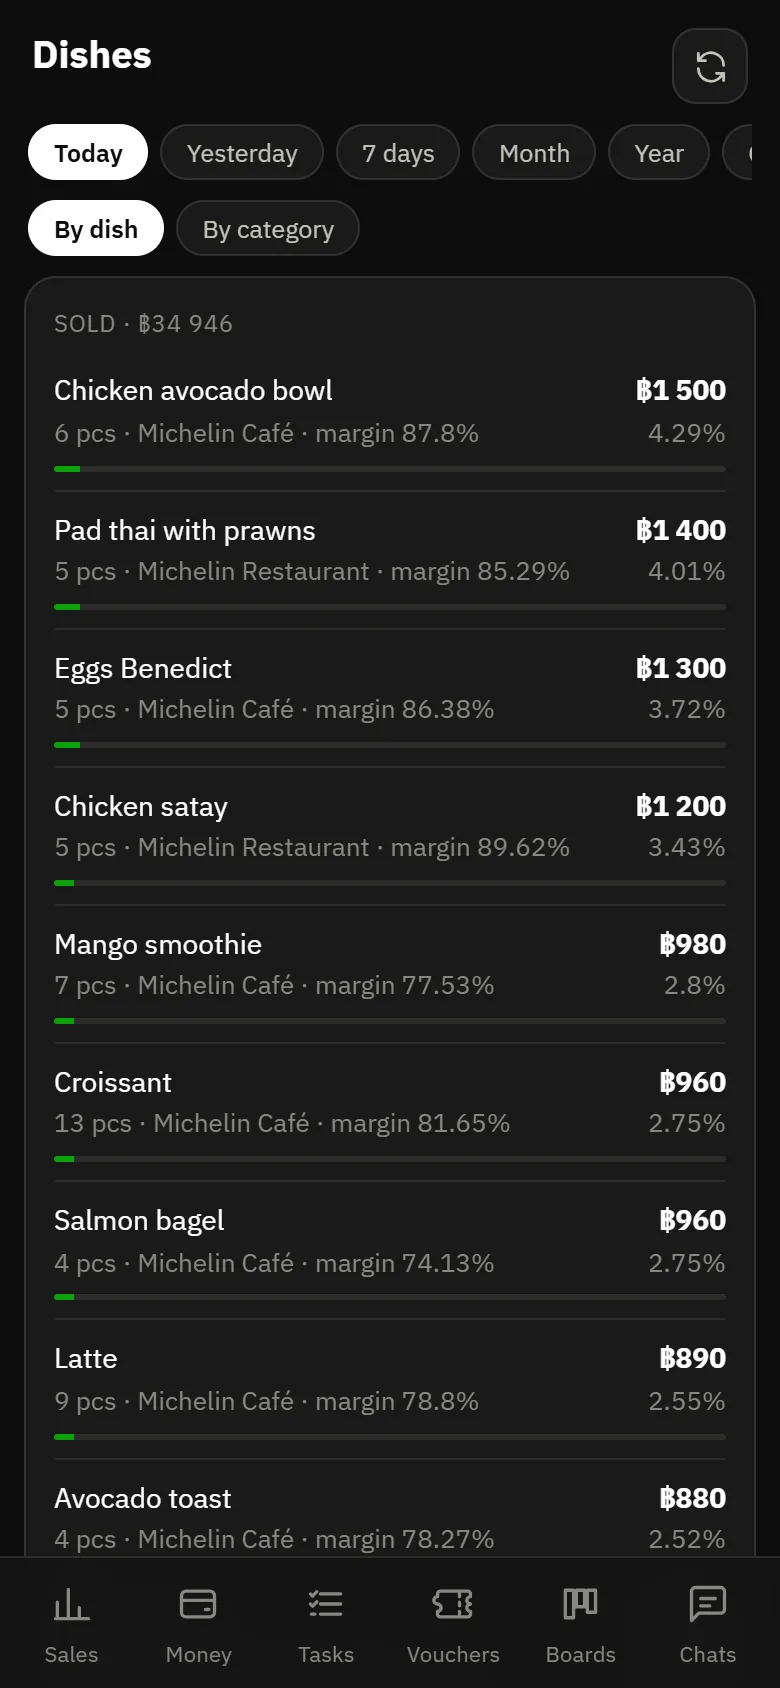
What sells
Sales by dish with quantity, share and margin. You can see items that sell a lot but bring in little.
When guests come
Breakdown by hour and day of the week: you can see when the venue is busiest and when there are more staff than needed.
Available reports
| Report | What it shows |
|---|---|
| Sales dashboard | Revenue, profit, margin, receipts, guests, average check, trends by day and hour |
| By dish | Quantity, revenue, share, cost and margin for each item |
| By employee | Revenue, average check, discounts and refunds for each waiter |
| By source | Dine-in, takeaway, website, aggregator — with campaign UTM tags |
| Payment methods | Cash, card, transfers, online — how much went through each |
| ABC analysis | A/B/C groups by revenue, profit or quantity; candidates for removal from the menu |
| Inventory | Ingredient consumption, stock levels, movements, stocktake discrepancies |
| Finance | Income and expenses by category, account movements, shifts |
How profit is calculated
Cost is fixed at the moment of sale and is not recalculated retroactively when a new delivery arrives. So last month’s report will show the same tomorrow as it does today.
- Open orders are not counted as revenue — they have not been paid yet
- Tips are not counted as venue revenue
- Refunds reduce the revenue of the day they were made and are shown separately
- For an aggregator, only the reconciled amount counts as revenue, net of commission
Questions about reports
Can I export the data?
Yes, sales by dish and other tables export to CSV — it opens in Excel and Google Sheets.
Can I see reports for the whole group at once?
Yes. The group owner sees combined figures for all venues and can open each one separately — in the back office and in POSik.
Why does revenue in the report differ from the cash in the drawer?
Because the drawer holds only cash, while revenue includes every payment method — and the other way round: the drawer also holds the float and pay-ins. The discrepancy is calculated when the shift closes and shown as a separate line.
See the reports in the demo
The demo has restaurant and cafe reports for the past 30 days.